GoldieBench Blog · 12 min read
Hermes Agent Dashboards: What Each One Shows, How To Open It, And What The Cost Page Says About Your Model
Hermes Agent dashboards explained: 9 options, which one shows sessions, costs, kanban, memory, cron and an agent office, then the models worth the spend.
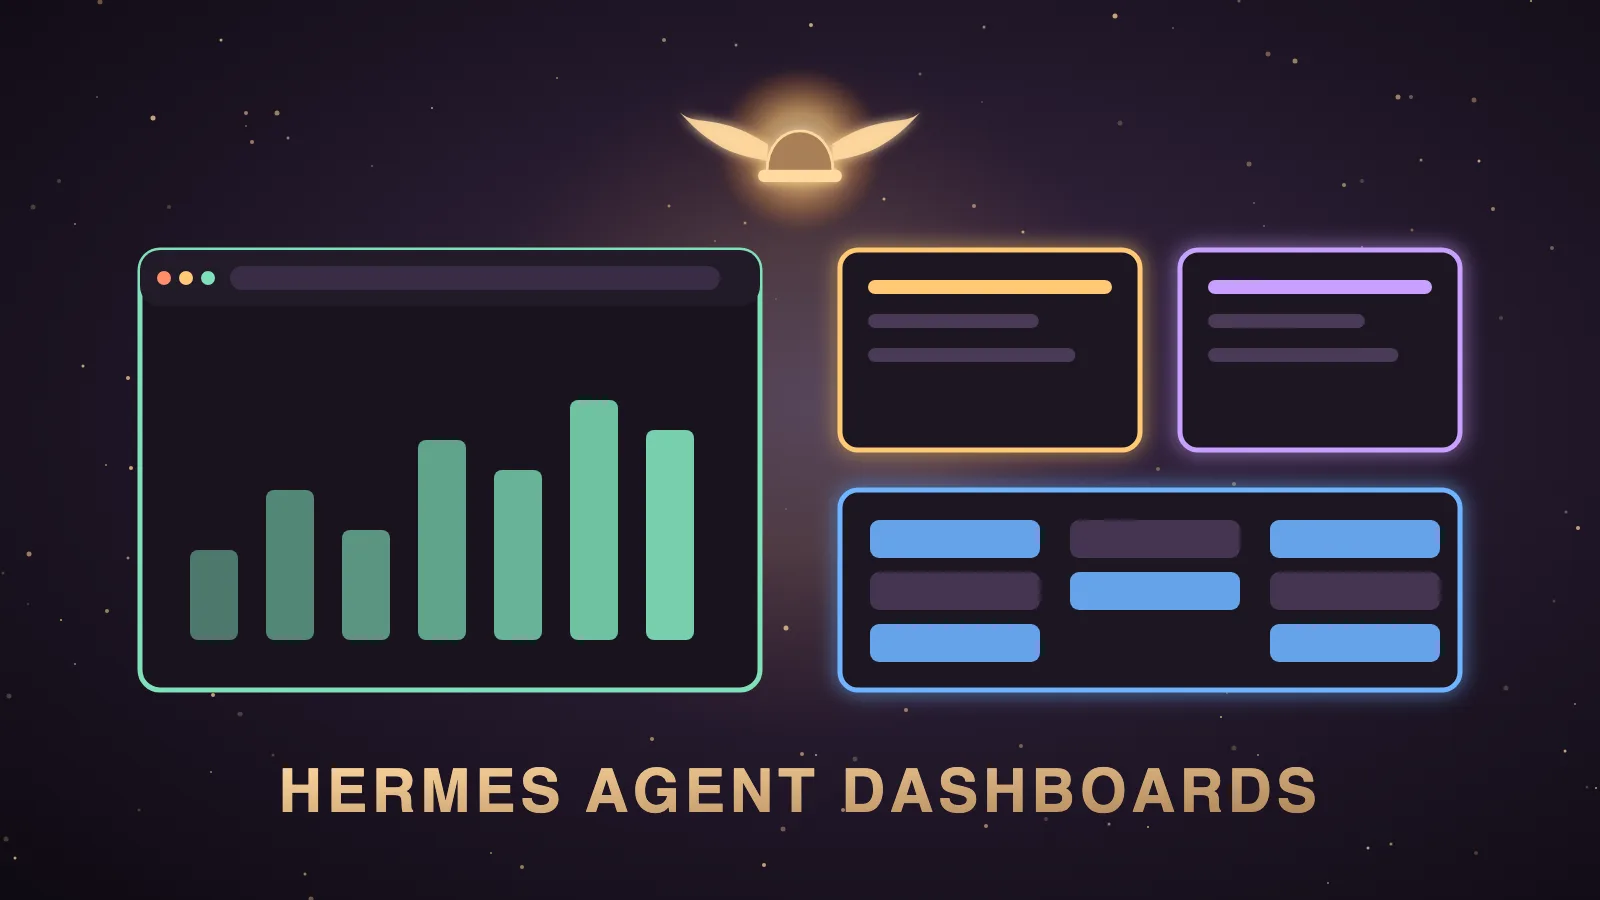
Hermes Agent dashboards are the screens that show you what your Hermes agent is doing, and there are nine worth knowing about.
The built-in one opens with a single command, hermes dashboard, and it shows sessions, costs, cron jobs and a kanban board in your browser.
The other eight are the kanban board itself, Hermes Desktop, Herald OS, Hermes Workspace, Hermes WebUI, Hermes Pixel Office, Hermes3D and my own Agent OS.
Hermes Agent is the free, open-source AI agent from Nous Research, and every one of these screens reads the same install.
I'll give you the "which dashboard shows what" table first, then how each one works and how to open it, then the limits, and finally what the cost page tells you about the model behind it.
Which Hermes Agent dashboard shows what
| What you want to see | The dashboard I'd open first | Also shows it |
|---|---|---|
| Sessions | The Sessions page of the built-in web dashboard | Hermes Desktop, Hermes WebUI, Hermes Workspace |
| Costs and tokens | The Analytics page of the built-in web dashboard | Hermes WebUI, Hermes Workspace, Herald OS |
| Kanban and tasks | The Kanban tab of the built-in web dashboard | Hermes Desktop, Hermes Workspace, Hermes3D |
| Memory | The Memory Graph in Hermes Desktop | Hermes WebUI, Hermes Workspace, Herald OS |
| Cron jobs | The Cron page of the built-in web dashboard | Hermes Desktop, Hermes WebUI, Herald OS |
| A multi-agent office | Hermes Pixel Office | Hermes3D, Hermes Workspace |
My own Agent OS shows all six in one place, but it is my own product, so I have kept it out of the first-pick column.
What Hermes Agent dashboards are and why they matter
Hermes Agent started in the terminal, and a terminal does not show you what happened while you were away.
A dashboard is a screen that reads the same Hermes install and shows you its state.
The official docs say the front-ends all talk to the same agent and share state, so two dashboards are two windows onto one agent.
That makes the choice low risk, because you can add or drop a dashboard at any time.
I checked every command in this post against the help output on my own Hermes install on 14 October 2026.
I checked each third-party project on its own GitHub page on the same day.
The nine Hermes Agent dashboards at a glance
| Dashboard | Who makes it | Cost | How you open it |
|---|---|---|---|
| Web dashboard | Nous Research (built in) | Free | hermes dashboard, which opens 127.0.0.1 on port 9119 |
| Kanban board | Nous Research (bundled plugin) | Free | hermes kanban init, then the Kanban tab of the dashboard |
| Hermes Desktop | Nous Research (official) | Free | hermes desktop, or the installer |
| Herald OS | Luke The Dev (independent) | Free, alpha | The GitHub releases page, after installing Hermes |
| Hermes Workspace | outsourc-e (community) | Free | The one-line installer, then pnpm dev |
| Hermes WebUI | nesquena (community) | Free | Clone, then python3 bootstrap.py |
| Hermes Pixel Office | Teknium | Free | Clone into plugins, enable it, then open port 8113 |
| Hermes3D | LukeTheDev (independent) | Free | Clone, npm install, then npm run dev |
| My Agent OS | Me | Inside the AI Profit Boardroom | An installable zip for members |
How the built-in Hermes dashboard works
The built-in dashboard ships with Hermes, so there is nothing to install.
You run hermes dashboard, and it starts a local web server and opens 127.0.0.1 on port 9119.
The docs say it runs entirely on your machine and no data leaves localhost.
Its pages are Status, Chat, Config, API Keys, Sessions, Logs, Analytics, Cron, Profiles, Skills, MCP, Webhooks, Pairing, Channels and System.
One server manages every profile on the machine, and a profile switcher in the sidebar decides which profile you are editing.
The --port flag moves it to another port, and the --no-open flag starts it without opening a browser tab.
The --status flag lists running servers, and the --stop flag stops them.
If you bind it to anything other than 127.0.0.1, it refuses to start until a password or a sign-in is configured.
Sessions: where to see what your agent did
The Sessions page lists every session with its title, source platform, model, message count and tool call count.
Tabs for Chats, Automation and All hide cron and API noise, and a search box searches every message.
You can rename a session, export it as JSON, or press the play icon to resume it in the Chat tab.
The Status page lists the 20 most recent sessions with their model and token usage, and it refreshes every five seconds.
Hermes Desktop has its own session list with archiving, and Hermes WebUI keeps sessions in its left sidebar.
The terminal version is hermes sessions list.
Costs and tokens: where to see what you spent
The Analytics page is the most useful screen for anyone who cares about model choice.
You pick 7, 30 or 90 days, and it shows total input and output tokens, the cache hit percentage, the total cost and the session count.
A daily chart and a daily table show how usage moved, and a per-model table shows each model's sessions, tokens and estimated cost.
The terminal version is hermes insights, which takes a --days flag.
Hermes WebUI shows input tokens, output tokens and estimated cost per conversation, and its README says that display is off by default.
Hermes Workspace lists a cost ledger and a model mix on its Dashboard page.
Herald OS has a Usage view, which its README describes as what Hermes used this week and this month, with a warning at 90% of your model plan.
Hermes Desktop has a context meter with a token breakdown, plus optional cache hit rate and tokens per second in its status bar.
Kanban and tasks: where to see the work in progress
The kanban board is a bundled dashboard plugin, so it appears as a Kanban tab inside the built-in dashboard.
You run hermes kanban init once to create the board, and then you open the dashboard.
The board has columns for triage, todo, ready, running, blocked and done, and you drag cards between them.
Updates arrive live, so a task an agent finishes in the background moves without a refresh.
You can set a model for a single task, which matters later in this post.
Hermes Desktop has a Kanban page with a board switcher, and Hermes Workspace has its own Kanban TaskBoard that I use as an AI to-do list.
The terminal versions are hermes kanban watch and hermes kanban stats.
Memory: where to see what your agent knows
The built-in dashboard only picks a memory provider and resets the built-in stores, so it is not a memory browser.
Hermes Desktop has a Memory Graph, which maps learned skills and memories on a zoomable timeline.
Hermes WebUI lets you view and edit the MEMORY.md and USER.md files inline.
Hermes Workspace lets you browse, search and edit agent memory.
Herald OS has a Memory page, and I spotted my Telegram details sitting in mine, so check yours before you share a screen.
The terminal version is hermes journey.
Cron jobs: where to see what runs without you
The Cron page shows each job's prompt, schedule, state, delivery target, last run and next run.
You can create, pause, edit, trigger or delete a job from that page.
Hermes Desktop has a Cron pane with an "All profiles" switch, and Hermes WebUI calls its version Tasks.
Herald OS calls its version Automations, and my automations synced across Herald OS, Hermes Desktop and my Agent OS.
A multi-agent office: where to see who is working
Hermes Pixel Office is a free plugin by Teknium that shows every session and every delegated subagent as a pixel character at a desk.
A red exclamation mark appears over any agent that is waiting for your approval.
Its README says it is visual only, so it watches agents and never controls them.
Hermes3D is the 3D take on the idea, and its README calls it a 3D virtual office for AI agents that you run on your own infrastructure.
I have not tested Hermes3D, so that description comes from its README and not from my own use.
It is an unofficial community project that is not made by Nous Research, and it has had one release with no pushes since late August 2026.
The full docs-based walkthrough is in my Hermes3D post.
How to open the other Hermes Agent dashboards
Hermes Desktop
Hermes Desktop is the official native app for macOS on Apple Silicon, Windows and Linux.
You run hermes desktop if Hermes is installed, or you download the installer from the Hermes Desktop page.
It uses the same config, keys, sessions, skills and memory as the command line.
Herald OS
Herald OS is an independent agent OS with Hermes as the interface, and its README marks it as an alpha at version 0.1.
On a Mac you need macOS 13 or later on Apple Silicon, and you install Hermes first and then download the build from the releases page.
The build is not notarised yet, so its README gives one xattr command to run before it opens.
My walkthrough is in my Herald OS post.
Hermes Workspace
Hermes Workspace is a community command centre, and it needs Node 22 or later.
You run its one-line installer, then hermes gateway run in one terminal and pnpm dev in another, and you open localhost on port 3000.
Its README says hermes dashboard must also be running on port 9119, because that is where its sessions, skills, config and jobs data come from.
Hermes WebUI
Hermes WebUI is a community browser app built with Python and plain JavaScript, so there is no build step.
You clone the repository and run python3 bootstrap.py, and you reach it from a phone through an SSH tunnel or Tailscale.
Hermes Pixel Office
You clone Pixel Office into ~/.hermes/plugins/pixel-office and run hermes plugins enable pixel-office.
You then start a new Hermes session and open 127.0.0.1 on port 8113.
Hermes3D
The README's quick start is to clone the repo, run npm install, copy .env.example to .env and run npm run dev.
It needs Node.js 20 or later, and the README says it does not install Hermes for you.
Where my own Agent OS fits
I run Hermes inside my own Agent OS every day, and I am biased about it because I built it.
It gives one Hermes thirteen rooms next to Claude and my other agents, with a kanban board, an Office tab and an Obsidian vault for memory.
Its Manage room embeds the full Hermes dashboard, so sessions, models, logs, cron jobs and skills are one click away.
There is no public GitHub repo for it, and access is inside the AI Profit Boardroom as an installable zip.
I explain why it is my daily pick in my best UI for Hermes Agent ranking.
The honest limits of every Hermes Agent dashboard
The built-in dashboard is an admin panel, and its Chat tab simply embeds the terminal interface.
The docs warn that the kanban routes become reachable from the network if you bind the dashboard publicly.
Hermes Desktop's docs describe token meters rather than a cost ledger, so I use the Analytics page for money.
Herald OS is an alpha, it has Missions rather than a kanban board, and its Connections page did not sync for me.
Hermes Workspace needs the gateway and the dashboard running behind it.
Hermes WebUI's feature list does not describe a kanban board, so check the repo before you rely on it for tasks.
Pixel Office only watches, so it cannot stop a bad run.
No single free dashboard shows all six views, but the built-in dashboard plus Hermes Desktop plus Pixel Office covers them between them.
If you want the free front-ends ranked, read the best Hermes Agent UI.
No Hermes Agent dashboard ships its own model
Here is the part that links these screens to this site.
Not one of these dashboards comes with its own model, because each one shows whatever model your Hermes install is connected to.
The Analytics page tells you what each model cost you and how many sessions it handled.
It does not tell you whether the work was any good.
That second half is what I built GoldieBench to measure.
So I read the two together, with the dashboard for the spend and the board for the quality.
Reading the per-model cost table next to real bench scores
These are live averages from the board on 14 October 2026, with the pricing line each model page shows.
| Model | Live avg | Tasks scored | Pricing shown on the model page |
|---|---|---|---|
| Claude Opus 5 | 8.27 | 50 | $5 / $25 per M |
| Hermes MoA | 8.17 | 47 | Panel + aggregator calls (via OpenRouter) |
| GPT-5.6 Sol | 8.16 | 50 | $5 / $30 per M |
| Qwen 3.8 | 8.10 | 45 | Qoder plan |
| MiniMax M3 | 7.97 | 47 | $0.30 / 1M input tokens, $1.50 / 1M output |
| Kimi K3 | 7.89 | 50 | $3 / M in |
| GLM-5.2 | 7.77 | 47 | Open weights, free for individuals |
| Claude Opus 5.5 | 7.57 | 50 | $4 / $20 per M |
Claude Opus 5 is the top single model in that table, and MiniMax M3 sits only 0.30 points behind it at a far lower listed price.
That is the kind of gap the per-model table in the Analytics page makes visible in your own usage.
If one expensive model is handling most of your sessions, the board gives you cheaper models to test on the same work.
For the Hermes-specific breakdown, read the best Hermes Agent model and the best LLMs for Hermes Agent.
Using the kanban board to send each task to the right model
The Hermes kanban docs describe a per-task model override, which you set when you create a task or from the board's model dropdown.
That means the model choice does not have to be one decision for the whole install.
I'd keep a cheaper model as the default and pin a stronger one to the cards that need it.
On the numbers above, that could mean MiniMax M3 at 7.97 for routine cards and Claude Opus 5 at 8.27 for the builds that matter.
Hermes MoA at 8.17 is the Hermes-native mixture of agents, so it is a third option you can pick inside Hermes itself.
The Analytics page then shows you whether the split actually changed your spend.
Free and local models behind a free dashboard
Every free dashboard here can stay free if the model is free too.
The strongest local model I have benched is Qwable 5 27B Coder, with a live average of 7.14 across 41 tasks on my own Mac.
The free-tier Laguna XS 2.1 averages 3.93 across 42 tasks, so I would keep it on light chores.
The per-model table in the Analytics page lists each model you used, so you can see how much of your work a local model is handling.
The local models board lists everything I have run on my own machine, and the best local model for Hermes Agent goes deeper.
What GoldieBench does and does not tell you about a dashboard
GoldieBench gives every model the same one-shot prompt to build a game, a page or a simulation, and then scores the rendered result from 0 to 10.
The methodology page explains exactly how each build is scored.
That maps well to the build tickets you would put on a kanban board.
It does not measure how clear a dashboard is, how fast it opens or how well it syncs.
No dashboard is on the board, because the board scores models.
So use this guide to pick the screen, use the Analytics page to see your spend, and use the board to pick the brain.
Also On Our Network
- Agent Operatorsthe exact command to open every Hermes dashboard
- AI Income Deskwhich Hermes dashboard a business should check each morning
- AI Tool Verdictnine Hermes dashboards compared view by view
- agentos.guidea quick-start for each dashboard inside an Agent OS
- agentos.guideThe Hermes Command Desk on agentos.guide
Open the built-in screen first, read its cost page next to the live board, and you will get real value from your Hermes Agent dashboards.
FAQ
What are Hermes Agent dashboards?
Hermes Agent dashboards are the screens that show what your Hermes agent is doing. The built-in one opens with the command hermes dashboard, and the others are the kanban board, Hermes Desktop, Herald OS, Hermes Workspace, Hermes WebUI, Hermes Pixel Office, Hermes3D and my own Agent OS.
Which Hermes Agent dashboard shows cost per model?
The Analytics page of the built-in web dashboard has a per-model table with sessions, token usage and estimated cost for 7, 30 or 90 days. The command hermes insights shows token and cost analytics in the terminal.
Do Hermes Agent dashboards ship their own model?
No. Every dashboard in this guide shows whatever model your Hermes install is connected to. The dashboard changes what you can see, and the model decides how good the work is.
Which model should I run behind a Hermes dashboard?
Claude Opus 5 is the top single model in this post with a live GoldieBench average of 8.27 across 50 tasks, followed by Hermes MoA at 8.17 and GPT-5.6 Sol at 8.16. MiniMax M3 at 7.97 is a strong cheaper choice.
Are any Hermes Agent dashboards on GoldieBench?
No. GoldieBench scores models on one-shot builds, and a dashboard is a screen and not a model. Hermes3D is also not something I have tested, so my notes on it come from its README.
Is Julian's Agent OS a free Hermes dashboard?
No. My Agent OS is not on public GitHub, and access is inside the AI Profit Boardroom as an installable zip. The built-in dashboard, Hermes Desktop and the community dashboards are free.
Keep reading
 Hermes Herald AI Agent: Which Brain To Run It On, With Real GoldieBench Scores
 Herald OS: What It Is, How To Set It Up, And Which Benchmarked Models To Run Under It
 Hark AI Agent: What It Is, The Model Behind It, And How Those Brains Score On GoldieBench
🌐 Sister-site take: read this on agentos.guide